|
Cusum-Ophthalmology
Cataract Surgery Performance Monitoring Via eCUSUM
-
Introduction
-
Participation
-
Procedures for
CUSUM charting
-
Outcome
measurements (CUSUM parameters)
-
Standard of
performance
-
Exclusion
Criteria /Filter
-
Pre-requisite of
eCUSUM
-
Use of CUSUM
-
Instruction
-
How to interpret
CUSUM charts?
-
Example of CUSUM
charts
-
Making CUSUM
monitoring meaningful
Introduction
Cataract surgery is the commonest procedure done in
ophthalmology departments. The procedure is quite consistent
and outcome is measured by visual acuity. Cataract surgery
outcome depends greatly on surgeons’ skill. With advancement
in technology and intraocular lens implantation, good visual
outcome is almost certain among patients without
pre-existing ocular co-morbidity. Hence, monitoring and
evaluating competency of surgeons, especially trainees’
performance are essential and in fact mandatory in ensuring
patient safety and standard of care.
Cumulative Sum (CUSUM) analysis is a statistical process
control tool designed to monitor outcome of a sequential
procedure performed over time by an individual operator. The
CUSUM formula is as follow:
CUSUM C = max (0, Cn-1 + Xn – k)
C = case
n = no. of procedures (in a chronological, consecutive
order)
Xn =outcome measure for the nth procedure.
For binary outcome, Xn= 0 (success ), Xn=1(failure)
For outcome with continuous variable, Xn=SD unit
k= reference or target value (pre-specified standard of
performance, which is defined in terms of acceptable failure
rate (p1) and unacceptable failure rate (p2).
The performance is acceptable as long as the CUSUM score
remains below a limit or standard (h). h denotes the
decision interval, determined by specifying the in-control
(IC) and out-of control (OC) average run length (ARL) of a
CUSUM chart.
(Refer publications on statistical analysis on CUSUM at
https://app.acrm.org.my/eCUSUM)
CUSUM analysis is displayed as a graph with numbering of
sequential event at X axis and CUSUM score at Y axis. At
acceptable performance when the score is below h, the chart
stays flat. At unacceptable performance, when the score is
above h, the chart slopes upwards and eventually crosses the
decision interval if it has successive failures. When the
operator overcomes his learning curve, the chart flattens to
the decision interval.
CUSUM analysis has been applied in the monitoring of
cataract surgery performed by trainees in Hospital Selayang
since 2007. With supervisors’ intervention to trainees with
unacceptable performance, we have observed dynamic positive
changes in trainees’ performance, displayed as flattening of
CUSUM curve. Thus, we are convinced that CUSUM technique is
an objective, transparent, effective, and a robust way in
monitoring surgical performance. It can be used by all
cataract surgeons as self audit and as competency monitoring
tool for trainees under supervision.
Cataract Surgery Registry (CSR), established since 2002,
captures all the data required for CUSUM charting. With data
mining from CSR, CUSUM charts can now be generated on eCUSUM
web page, without needing to enter any data. By doing so,
monitoring surgeons’ competency in cataract surgery is made
most effective and easy.

back to top
Participation
All cataract surgeons are welcomed to participate in eCUSUM.
Those who wish to take part have to participate in the
Cataract Surgery Registry. (See
detail)
back to top
Procedures for CUSUM charting
|
1. |
Phacoemulsification (phaco) |
|
2. |
Extracapsular cataract extraction (ECCE) |
back to top
Outcome measurements (CUSUM parameters)
|
1. |
Posterior capsular rupture (PCR) |
|
2. |
Postoperative refracted visual acuity by 12 weeks
post-op, excluding patients with pre-existing ocular
co-morbidity |
|
3. |
Surgical-induced astigmatism |
back to top
Standard of performance
Standards are based on national average from the CSR
findings.
|
|
Outcomes |
Acceptable performance (P1) |
Unacceptable performance (P2) |
|
1. |
Rate of
PCR for both ECCE and Phaco |
<5% |
>10% |
|
2.
|
Post-operative refracted visual acuity 6/12 or
better by 12 weeks post-operatively |
|
|
|
- ECCE |
>80% |
<64% |
|
- Phaco |
>85% |
<82% |
|
3.
|
Surgical-induced astigmatism recorded in refraction
by 12 weeks post-operatively |
|
|
|
- ECCE |
< 3
diopters cylinder power |
> 5
diopters cylinder power |
|
- Phaco |
< one
diopter cylinder power |
> 2
diopters cylinder power |
back to top
Exclusion Criteria /Filter
Post-operative refracted visual outcome charting – exclude
patients with pre-existing ocular co-morbidity
PCR and surgically induced astigmatism –no exclusion
criteria
back to top
Pre-requisite of eCUSUM
-
Ensure complete records of patients who had cataract
surgery are entered into cataract surgery registry (CSR)
i.e. pre-clerking, operative records particularly
intra-operative complications and post-operative
refracted vision. For patients who do not have
post-operative refracted vision but their unaided or pin
hole vision is 6/12 or better, you can put this vision
in the refracted vision column.
-
As CUSUM monitoring is on specific individual surgeon,
there can only be one surgeon‘s name entered in the
operative record in CSR web application. The main
surgeon‘s name should be entered. If both contributed to
the surgery equally, the one who has created the
intra-operative complication, if any, should be entered
as the surgeon.
-
When entering data to CSR web application, surgeons’
names are to be selected from the pull down list. No
free text entry of names is allowed to avoid spelling
mistake or same surgeon with different spelling of
names.
back to top
Use of CUSUM
-
All surgeons
Surgeons whose patients they operated on have records in
the CSR can view his/ her CUSUM chart for self
monitoring.
-
Trainee under supervision
CUSUM charts of trainees shall be monitored by their
supervisors and head of departments. Trainees include
doctors in the Postgraduate Ophthalmology training,
service medical officers and gazetting specialists.
Supervisors will see charts belonging to trainees
assigned to them. Heads of departments will be able to
review charts belonging to all the trainees and
gazetting specialists.
back to top
Instruction
Steps in eCUSUM charting and viewing
|
Step |
Function/ Icon on eCUSUM |
Descriptions |
|
0 |
Log on |
Go to NED
website and click on to eCUSUM
Or go straight to
https://app.acrm.org.my/eCUSUM
Type your username (same as NED web application
username) and password (default as cusum).
Change your password after the first log-in |
|
1 |
ID and Select Procedure |
Ensure you are the surgeon.
Select the procedures, either ECCE or phaco. |
|
2 |
Preview Data |
Check if data are correct and complete, e.g. check
that all the procedures are performed by you and
data are complete. If there are missing outcome
data, do retrieve patients’ note and update data in
CSR web application. |
|
3 |
Select Outcome |
Select either PCR or post- op (12 weeks) visual
acuity or astigmatism |
|
4 |
Select Standard |
As default |
|
5 |
Filter |
For post-op vision, do filter out patients with
pre-existing ocular co-morbidity
For PCR and surgically induced astigmatism, select
all subgroups
Select date. If no date is selected, CUSUM will
chart all the procedures performed. The later is
preferred to view the overall trend. |
|
6 |
Chart |
Click Chart and user will be able to see his/her
CUSUM chart and patient’s data below the chart.
Users can save their charts by
1. Click on ‘Select a format’ - Excel or PDF format
[Excel is preferred to enable data review using sort
and search functions]
2. Then click ‘ Export’
3. Save in individual’s folder. Trainees can send
these documents to supervisors as well. |
|
7 |
Show data |
These are data on procedures being charted. |
|
8 |
Show Excluded Data |
These are procedures which are being excluded,
mainly those with missing values.
With this list, users can go to CSR web application
to update the missing values. |
|
9 |
Submit Chart |
This icon will only appear on trainees log on. By
clicking on submit, an auto-generated email will be
sent to the supervisors and the trainees’ charts
will be seen on the supervisors log-on. |
|
10 |
Review Trainees’ Chart |
This icon will only appear on supervisor’s log- on.
Supervisor will see charts belonging to trainees
assigned to her/him. Heads of departments will be
able to review charts belonging to all the trainees
and gazetting specialists. |
|
|
Other instruction |
When charting, user has to click one step after
another in a forward direction without skipping a
step. When returning to other parameters, user can
go straight to step 3 : select outcome. |

back to top
How to interpret CUSUM charts?
Each event is represented as a dot on the chart. Surgeons
with surgical performance within the acceptable standard
will have their charts displayed along horizontal lines with
no up-peak or with peaks which are between 2 decision
intervals (horizontal lines drawn across the chart).
Surgeons with surgical performance outside the acceptable
standard will have charts which cross the decision
intervals. Once the chart has crossed a decision interval,
the chart will not return to X axis. If there is no more
failure, the chart slopes downward and flattens at the
previous decision interval. When the chart levels off, that
means the surgeon has improved his skill and has overcome
the learning curve.
However, if the chart goes upward and crosses a few decision
intervals, the surgeons should seek advice on ways to
improve their surgical performance.
Key Points in interpretation
Chart crosses horizontal lines when the standard of
performance is outside the defined standard.
Important to see the pattern:
1. Leveling of chart after an initial upward trend indicates
the surgeon has overcome the learning curve
2. Continuous upward trend crossing many decision intervals
indicate poor performance needing intervention.
3. Surgeon should review detail of patients for each
unsuccessful performance to determine the reasons for
failure and carry out corrective or remedial action.
back to top
Example of CUSUM charts

1. Posterior capsular rupture (PCR)
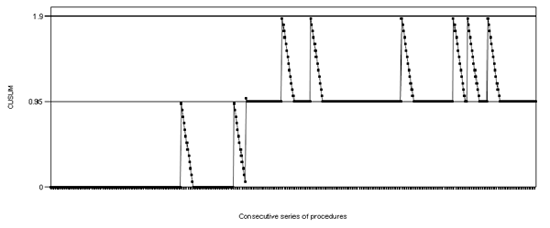
This chart is initially flat as there is no PCR. With 3
occurrences of PCR, the chart crossed one decision interval.
Following that there are a total of 6 PCR but occurring
intermittently and the chart stays within 2 decision
interval, denotes acceptable performance during this period.
2. Post-operative refracted vision among patient without
pre-existing ocular co-morbidity

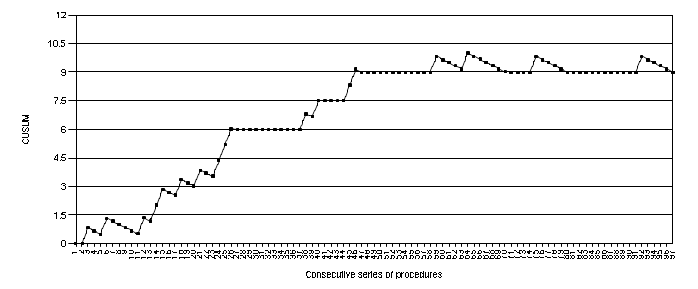
This chart reflects a typical learning curve, with initial
series of unsuccessful events follows by flattening or
leveling of curve. It is thus important to see the pattern
of chart, i.e. upward slope, downward slope or leveling of
slopes.
back to top
Making CUSUM
monitoring meaningful
-
What is the role of trainees?
Trainees should review their own charts, ensure data is
accurate and complete, and submit the chat to his/her
supervisor at a regular interval, at least once in 3
months.
Trainees should perform an adequate number of cases to
have meaningful CUSUM charts.
-
What is the role of supervisors?
Supervisors must review trainees’ chart once they
receive the email and discuss in person during the
3-monthly progress interview. Advice and guidance should
be given to trainees with poor performance. For trainees
with consistently poor performance, supervisors need to
supervise them closely and request for more frequent
CUSUM chart submission.
back to top
 |

